Design Automation Lab
A research lab developing methods and tools for supporting design decision making.
Studionet
- Title: Studionet: An Online Community for Learning Digital Design Tools and Techniques
- Project Period: 1 July 2016 to 30 April 2018
- Funding Source: NUS LIFT
- Principal Investigator: Patrick Janssen (PI)
- Co-Investigators: Rudi Stouffs (NUS), Abel Tablada (NUS)
- Budget: SGD $100,608
Research Overview
The research project will develop, test, deploy, and evaluate a platform for supporting student-centred collaborative learning in the design studio. The platform is called ‘Studionet’.


Research Aims and Objectives
Numerous studies and research papers have highlighted the limitations of conventional learning management systems (LMS), with many of them arguing that there is too much emphasis on teacher-led instruction and not enough on student-led collaborative learning. The Studionet platform aims to overcome these limitations. The platform will consist of a web application with a database to store contributions from students, teaching assistants, and staff. The platform will allow these contributions to be interlinked into complex graphs.
The Studionet platform will allow participants (including students, teaching assistants, staff, and guests) to perform the following actions:
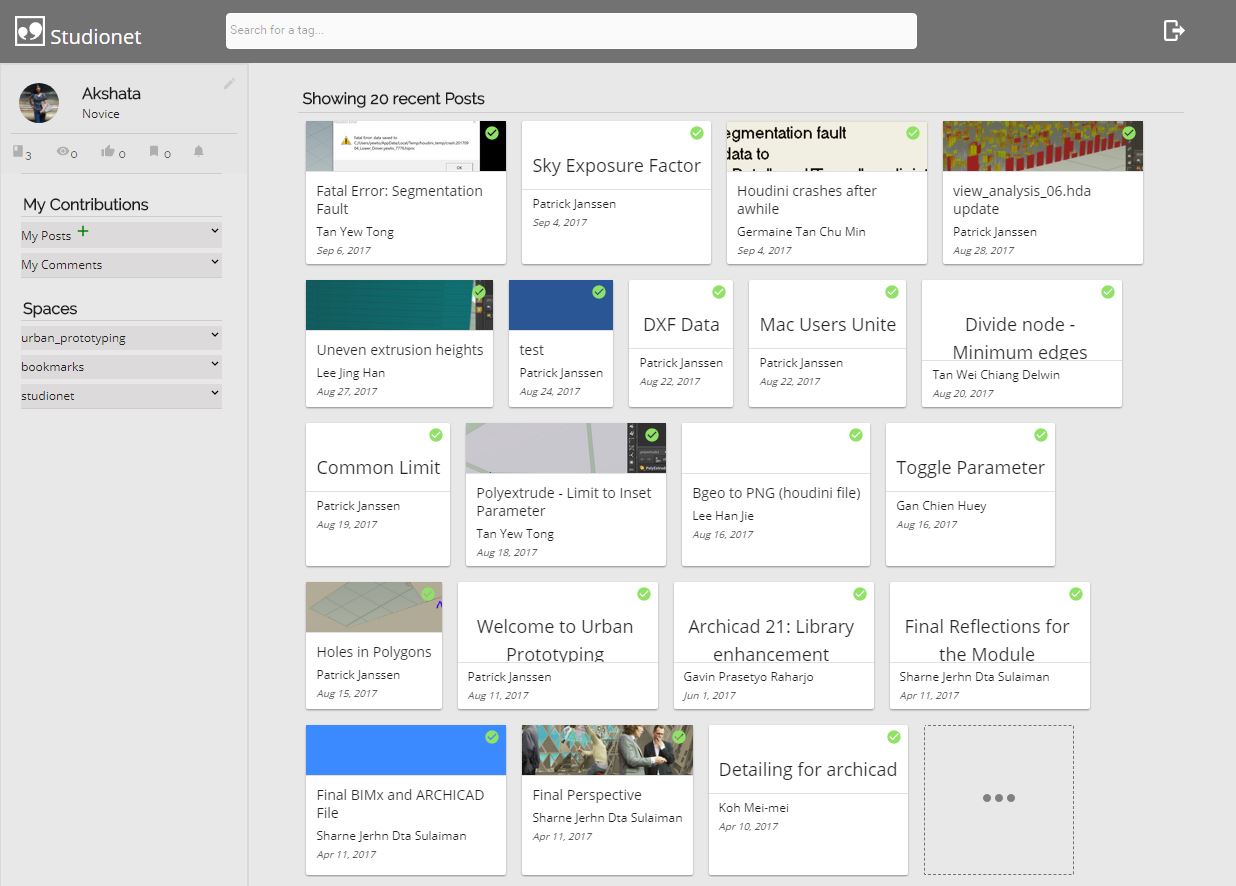
- To upload a variety of different contributions, including assignments, readings, models, results, narratives, questions, answers, comments, and so forth. The format of a contribution is similar to a blog post, and can be any combination of text and graphics, including animations and 3D models. In order to support design, the focus is on highly graphical contributions.
- To assign qualities to contributions by students. It is important that students qualify their submissions in such a way that other students may be able to express agreement or disagreement. Qualities can be assigned in the form of semantic labels, thereby allowing contributions to be clustered according to these labels. The labels for the clusters are not predefined, thereby allowing the most pertinent and relevant clusters to emerge over time.
- To rate contributions by other students, using a pre-set scale, ranging from zero stars to five stars. These ratings will dissuade students from creating trivial contributions with little impact. Teaching assistants will rate student contributions as well, and their ratings can be used to evaluate and assess student participation.
- To view statistics for both contributions and for users. For contributions, the statistics are accumulated from the activities of all participants, and may include number of links, number of page views, number of page reads, and so forth. For participants, the statistics are gathered from the activities of the participant, including number of contributions submitted, types of contributions, number of links created, and so forth.
The novelty of the Studionet platform lies in the way that the contributions and links are stored, queried, visualized and applied in a student-centred collaborative learning platform for design. A graph database is used to store the data, and a graph-based query language is used to query the data. This allows rich interactive visualizations to be generated on the fly from database queries that extract specific subsets of data.
Studionet allows participants to do the following:
- To interlink contributions into complex graphs, with no restrictions being placed on what can be linked to what. For example, one student may ask a question on how to model something. Another student may then answer that question by creating a link to a third student, who created a tutorial on that topic.
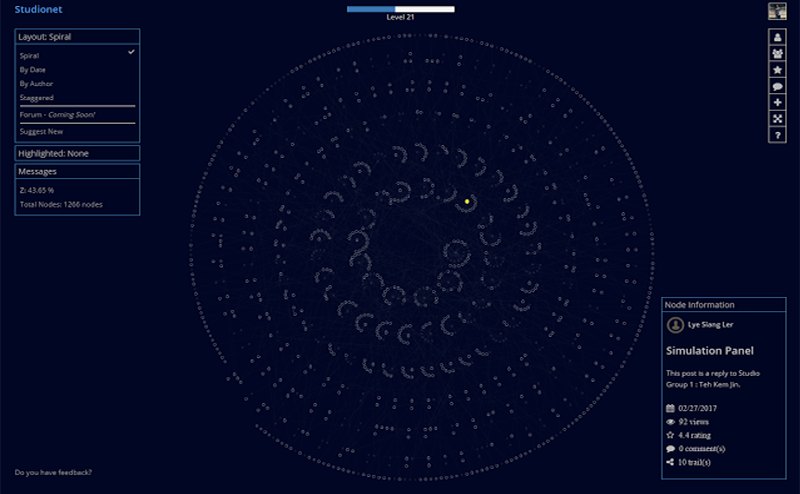
- To visualize the contributions and links through interactive navigable maps. These maps can represent the whole database, or can focus on a specific subset of data. For example, a map can be generated that depicts all interactions between two users, or that depicts all the projects that reference a certain idea.
- To search the contributions, queries can be directly entered by the user. These queries can range from simple to complex. The results of the queries can either be displayed as a simple list or can be converted into navigable maps.